项目集成prometheus和grafana
注意
此章节为了适配大麦AI项目的查询指标功能,需要 AI 从 prometheus 中获取数据,如果不学习大麦AI项目的话,prometheus和grafana可以不搭建
在实际的生产环境中,肯定是要对项目进行监控的,包括项目中重要接口的调用频率、jvm相关信息等等。而对于此信息的监控 prometheus 可以采集项目中的相关指标,并通过 grafana 进行图形化显示,本文来介绍如何在项目中集成这两者
项目依赖
添加监控依赖
<dependency>
    <groupId>org.springframework.boot</groupId>
    <artifactId>spring-boot-starter-actuator</artifactId>
</dependency>
添加prometheus依赖
<dependency>
    <groupId>io.micrometer</groupId>
    <artifactId>micrometer-registry-prometheus</artifactId>
</dependency>
<!-- micrometer 核心包,按需引入,使用 Meter 注解或手动埋点时需要 -->
<dependency>
    <groupId>io.micrometer</groupId>
    <artifactId>micrometer-core</artifactId>
</dependency>
<!-- micrometer获取JVM相关信息,并展示在Grafana上 -->
<dependency>
    <groupId>io.github.mweirauch</groupId>
    <artifactId>micrometer-jvm-extras</artifactId>
    <version>0.2.2</version>
</dependency>
项目配置
要在项目的配置文件中添加如下配置,以订单服务为例:
management:
  metrics:
    tags:
      application: order-service
  endpoint:
    health:
      show-details: always
  endpoints:
    web:
      exposure:
        include: '*'
  health:
    elasticsearch:
      enabled: false
  prometheus:
    metrics:
      export:
        enabled: true
以上的依赖和配置已在大麦项目中配置完毕了,这里列举出来作为参考学习
安装prometheus 和 Grafana
拉取 Docker 镜像
# 拉取 Prometheus 镜像
docker pull prom/prometheus:v2.47.0

# 拉取 Grafana 镜像
docker pull grafana/grafana:10.1.0

# 验证镜像
docker images | grep -E "prometheus|grafana"
创建目录和配置文件
创建目录结构
# 创建目录
mkdir -p ~/prometheus-grafana/prometheus
mkdir -p ~/prometheus-grafana/grafana

# 进入目录
cd ~/prometheus-grafana
创建 Prometheus 配置文件
macOS / Linux
cat > prometheus/prometheus.yml << 'EOF'
global:
  scrape_interval: 15s
  evaluation_interval: 15s
  external_labels:
    monitor: 'damai-monitor'

scrape_configs:
  # Prometheus 自身监控
  - job_name: 'prometheus'
    static_configs:
      - targets: ['localhost:9090']

  # 用户服务
  - job_name: 'user-service'
    metrics_path: '/actuator/prometheus'
    static_configs:
      - targets: ['host.docker.internal:6082']
        labels:
          application: 'user-service'

  # 基础数据服务
  - job_name: 'base-data-service'
    metrics_path: '/actuator/prometheus'
    static_configs:
      - targets: ['host.docker.internal:6083']
        labels:
          application: 'base-data-service'

  # 定制化服务
  - job_name: 'customize-service'
    metrics_path: '/actuator/prometheus'
    static_configs:
      - targets: ['host.docker.internal:6084']
        labels:
          application: 'customize-service'

  # 网关服务
  - job_name: 'gateway-service'
    metrics_path: '/actuator/prometheus'
    static_configs:
      - targets: ['host.docker.internal:6085']
        labels:
          application: 'gateway-service'

  # 节目服务
  - job_name: 'program-service'
    metrics_path: '/actuator/prometheus'
    static_configs:
      - targets: ['host.docker.internal:6086']
        labels:
          application: 'program-service'

  # 支付服务
  - job_name: 'pay-service'
    metrics_path: '/actuator/prometheus'
    static_configs:
      - targets: ['host.docker.internal:6087']
        labels:
          application: 'pay-service'

  # 迁移服务
  - job_name: 'migrate-service'
    metrics_path: '/actuator/prometheus'
    static_configs:
      - targets: ['host.docker.internal:6088']
        labels:
          application: 'migrate-service'

  # 订单服务
  - job_name: 'order-service'
    metrics_path: '/actuator/prometheus'
    static_configs:
      - targets: ['host.docker.internal:8081']
        labels:
          application: 'order-service'

  # Admin服务
  - job_name: 'admin-service'
    metrics_path: '/actuator/prometheus'
    static_configs:
      - targets: ['host.docker.internal:10082']
        labels:
          application: 'admin-service'

  # 黑马点评Plus服务
  - job_name: 'hmdp-plus'
    metrics_path: '/actuator/prometheus'
    static_configs:
      - targets: ['host.docker.internal:8085']
        labels:
          application: 'hmdp-plus'
EOF
Windows PowerShell
@"
global:
  scrape_interval: 15s
  evaluation_interval: 15s
  external_labels:
    monitor: 'damai-monitor'

scrape_configs:
  # Prometheus 自身监控
  - job_name: 'prometheus'
    static_configs:
      - targets: ['localhost:9090']

  # 用户服务
  - job_name: 'user-service'
    metrics_path: '/actuator/prometheus'
    static_configs:
      - targets: ['host.docker.internal:6082']
        labels:
          application: 'user-service'

  # 基础数据服务
  - job_name: 'base-data-service'
    metrics_path: '/actuator/prometheus'
    static_configs:
      - targets: ['host.docker.internal:6083']
        labels:
          application: 'base-data-service'

  # 定制化服务
  - job_name: 'customize-service'
    metrics_path: '/actuator/prometheus'
    static_configs:
      - targets: ['host.docker.internal:6084']
        labels:
          application: 'customize-service'

  # 网关服务
  - job_name: 'gateway-service'
    metrics_path: '/actuator/prometheus'
    static_configs:
      - targets: ['host.docker.internal:6085']
        labels:
          application: 'gateway-service'

  # 节目服务
  - job_name: 'program-service'
    metrics_path: '/actuator/prometheus'
    static_configs:
      - targets: ['host.docker.internal:6086']
        labels:
          application: 'program-service'

  # 支付服务
  - job_name: 'pay-service'
    metrics_path: '/actuator/prometheus'
    static_configs:
      - targets: ['host.docker.internal:6087']
        labels:
          application: 'pay-service'

  # 迁移服务
  - job_name: 'migrate-service'
    metrics_path: '/actuator/prometheus'
    static_configs:
      - targets: ['host.docker.internal:6088']
        labels:
          application: 'migrate-service'

  # 订单服务
  - job_name: 'order-service'
    metrics_path: '/actuator/prometheus'
    static_configs:
      - targets: ['host.docker.internal:8081']
        labels:
          application: 'order-service'

  # Admin服务
  - job_name: 'admin-service'
    metrics_path: '/actuator/prometheus'
    static_configs:
      - targets: ['host.docker.internal:10082']
        labels:
          application: 'admin-service'

  # 黑马点评Plus服务
  - job_name: 'hmdp-plus'
    metrics_path: '/actuator/prometheus'
    static_configs:
      - targets: ['host.docker.internal:8085']
        labels:
          application: 'hmdp-plus'
"@ | Out-File -FilePath prometheus/prometheus.yml -Encoding UTF8
创建 Docker 网络
# 创建自定义网络(容器间通信)
docker network create monitoring

# 验证网络创建
docker network ls | grep monitoring
创建数据卷
# 创建 Prometheus 数据卷
docker volume create prometheus_data

# 创建 Grafana 数据卷
docker volume create grafana_data

# 验证数据卷
docker volume ls | grep -E "prometheus|grafana"
启动 Prometheus
macOS / Linux
docker run -d \
  --name prometheus \
  --network monitoring \
  -p 9090:9090 \
  -v ~/prometheus-grafana/prometheus/prometheus.yml:/etc/prometheus/prometheus.yml \
  -v prometheus_data:/prometheus \
  --add-host=host.docker.internal:host-gateway \
  --restart=unless-stopped \
  prom/prometheus:v2.47.0 \
  --config.file=/etc/prometheus/prometheus.yml \
  --storage.tsdb.path=/prometheus \
  --storage.tsdb.retention.time=15d \
  --web.enable-lifecycle
Windows PowerShell
docker run -d `
  --name prometheus `
  --network monitoring `
  -p 9090:9090 `
  -v ${HOME}/prometheus-grafana/prometheus/prometheus.yml:/etc/prometheus/prometheus.yml `
  -v prometheus_data:/prometheus `
  --add-host=host.docker.internal:host-gateway `
  --restart=unless-stopped `
  prom/prometheus:v2.47.0 `
  --config.file=/etc/prometheus/prometheus.yml `
  --storage.tsdb.path=/prometheus `
  --storage.tsdb.retention.time=15d `
  --web.enable-lifecycle
验证 Prometheus
# 查看容器状态
docker ps | grep prometheus
# 查看日志
docker logs prometheus
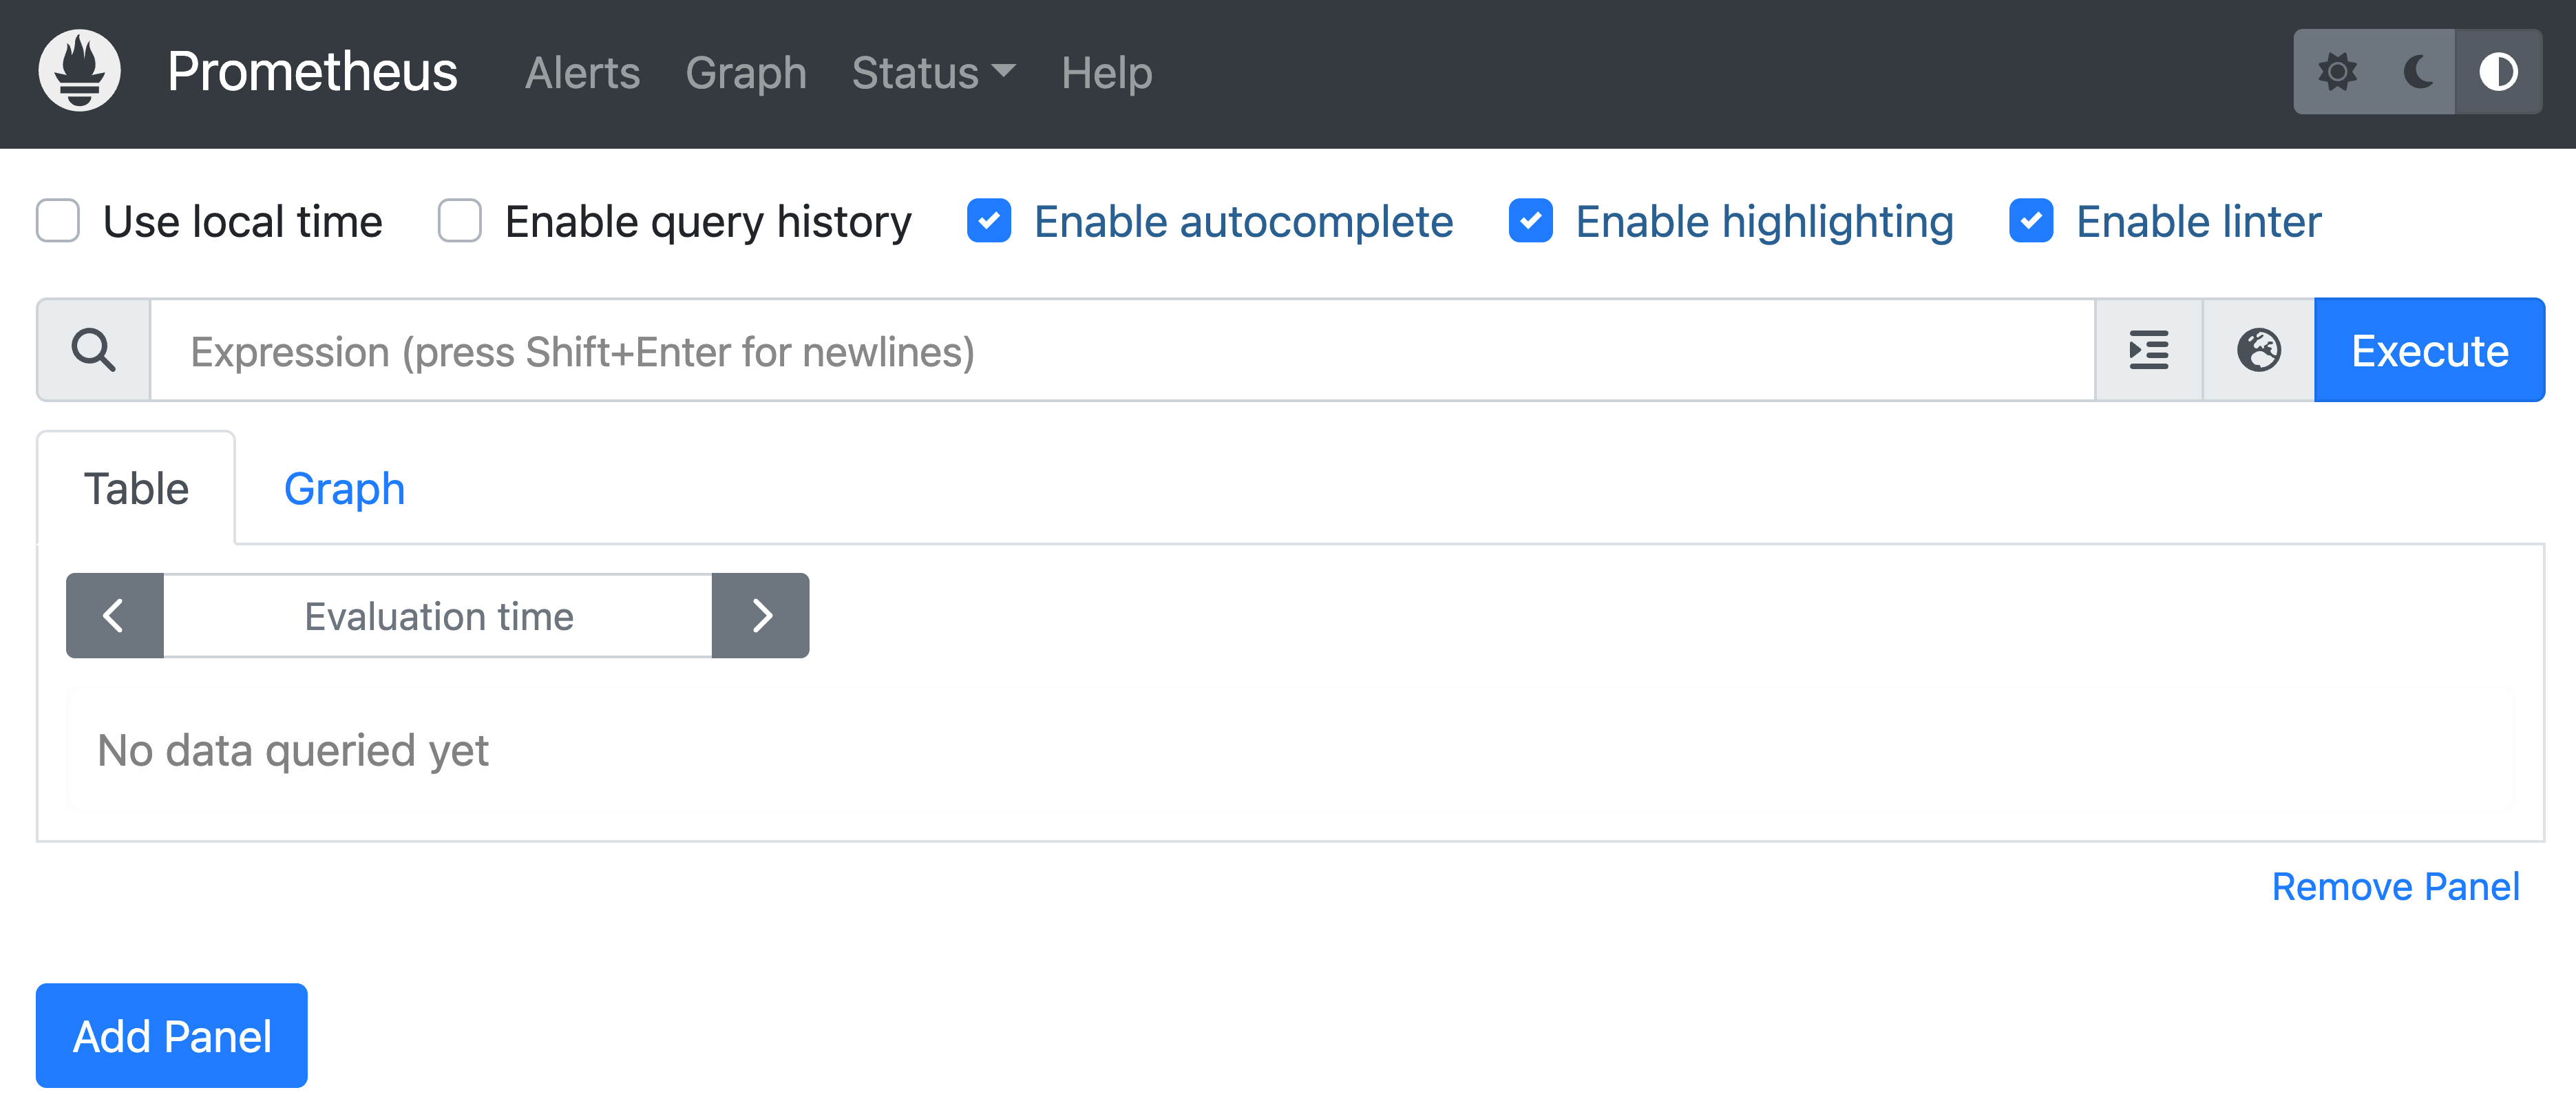
# 访问 Web UI
# 浏览器打开:http://localhost:9090
启动 Grafana
macOS / Linux / Windows
docker run -d \
  --name grafana \
  --network monitoring \
  -p 3000:3000 \
  -e GF_SECURITY_ADMIN_USER=admin \
  -e GF_SECURITY_ADMIN_PASSWORD=admin123 \
  -e GF_USERS_ALLOW_SIGN_UP=false \
  -v grafana_data:/var/lib/grafana \
  --restart=unless-stopped \
  grafana/grafana:10.1.0
Windows PowerShell(如果上面命令不兼容)
docker run -d `
  --name grafana `
  --network monitoring `
  -p 3000:3000 `
  -e GF_SECURITY_ADMIN_USER=admin `
  -e GF_SECURITY_ADMIN_PASSWORD=admin123 `
  -e GF_USERS_ALLOW_SIGN_UP=false `
  -v grafana_data:/var/lib/grafana `
  --restart=unless-stopped `
  grafana/grafana:10.1.0
验证 Grafana
# 查看容器状态
docker ps | grep grafana

# 查看日志
docker logs grafana
配置 Grafana 数据源
登录 Grafana
- 访问:http://localhost:3000
- 账号:
admin - 密码:
admin123
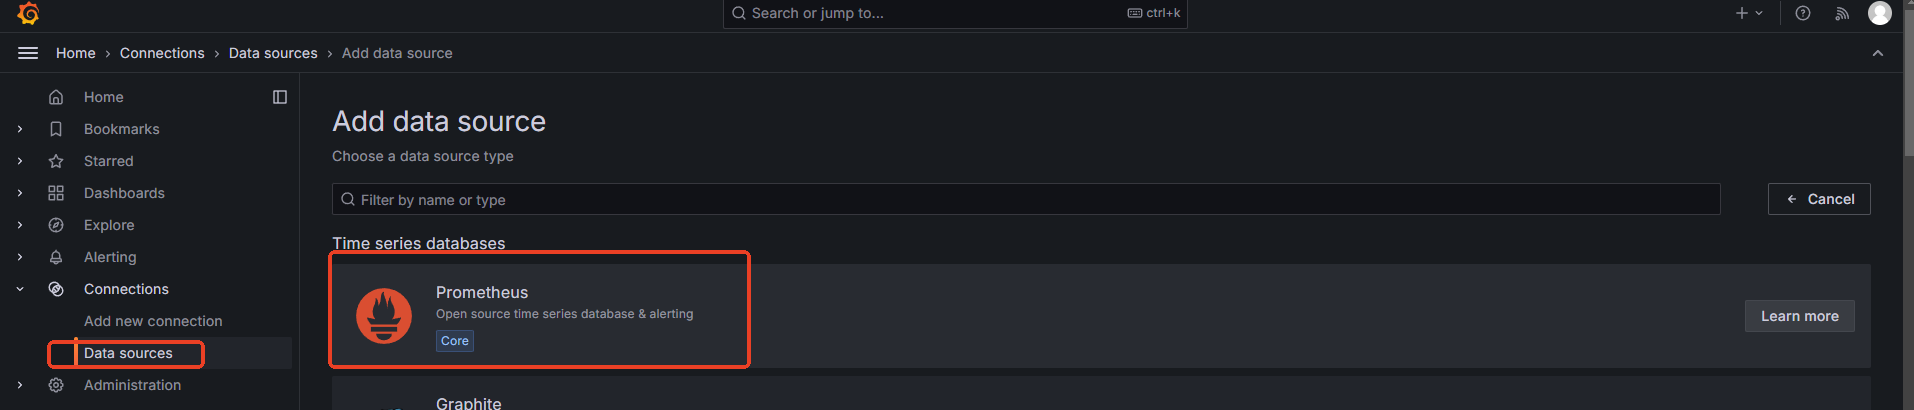
添加 Prometheus 数据源
- 进入 Connections → Data sources → Add data source
- 选择 Prometheus
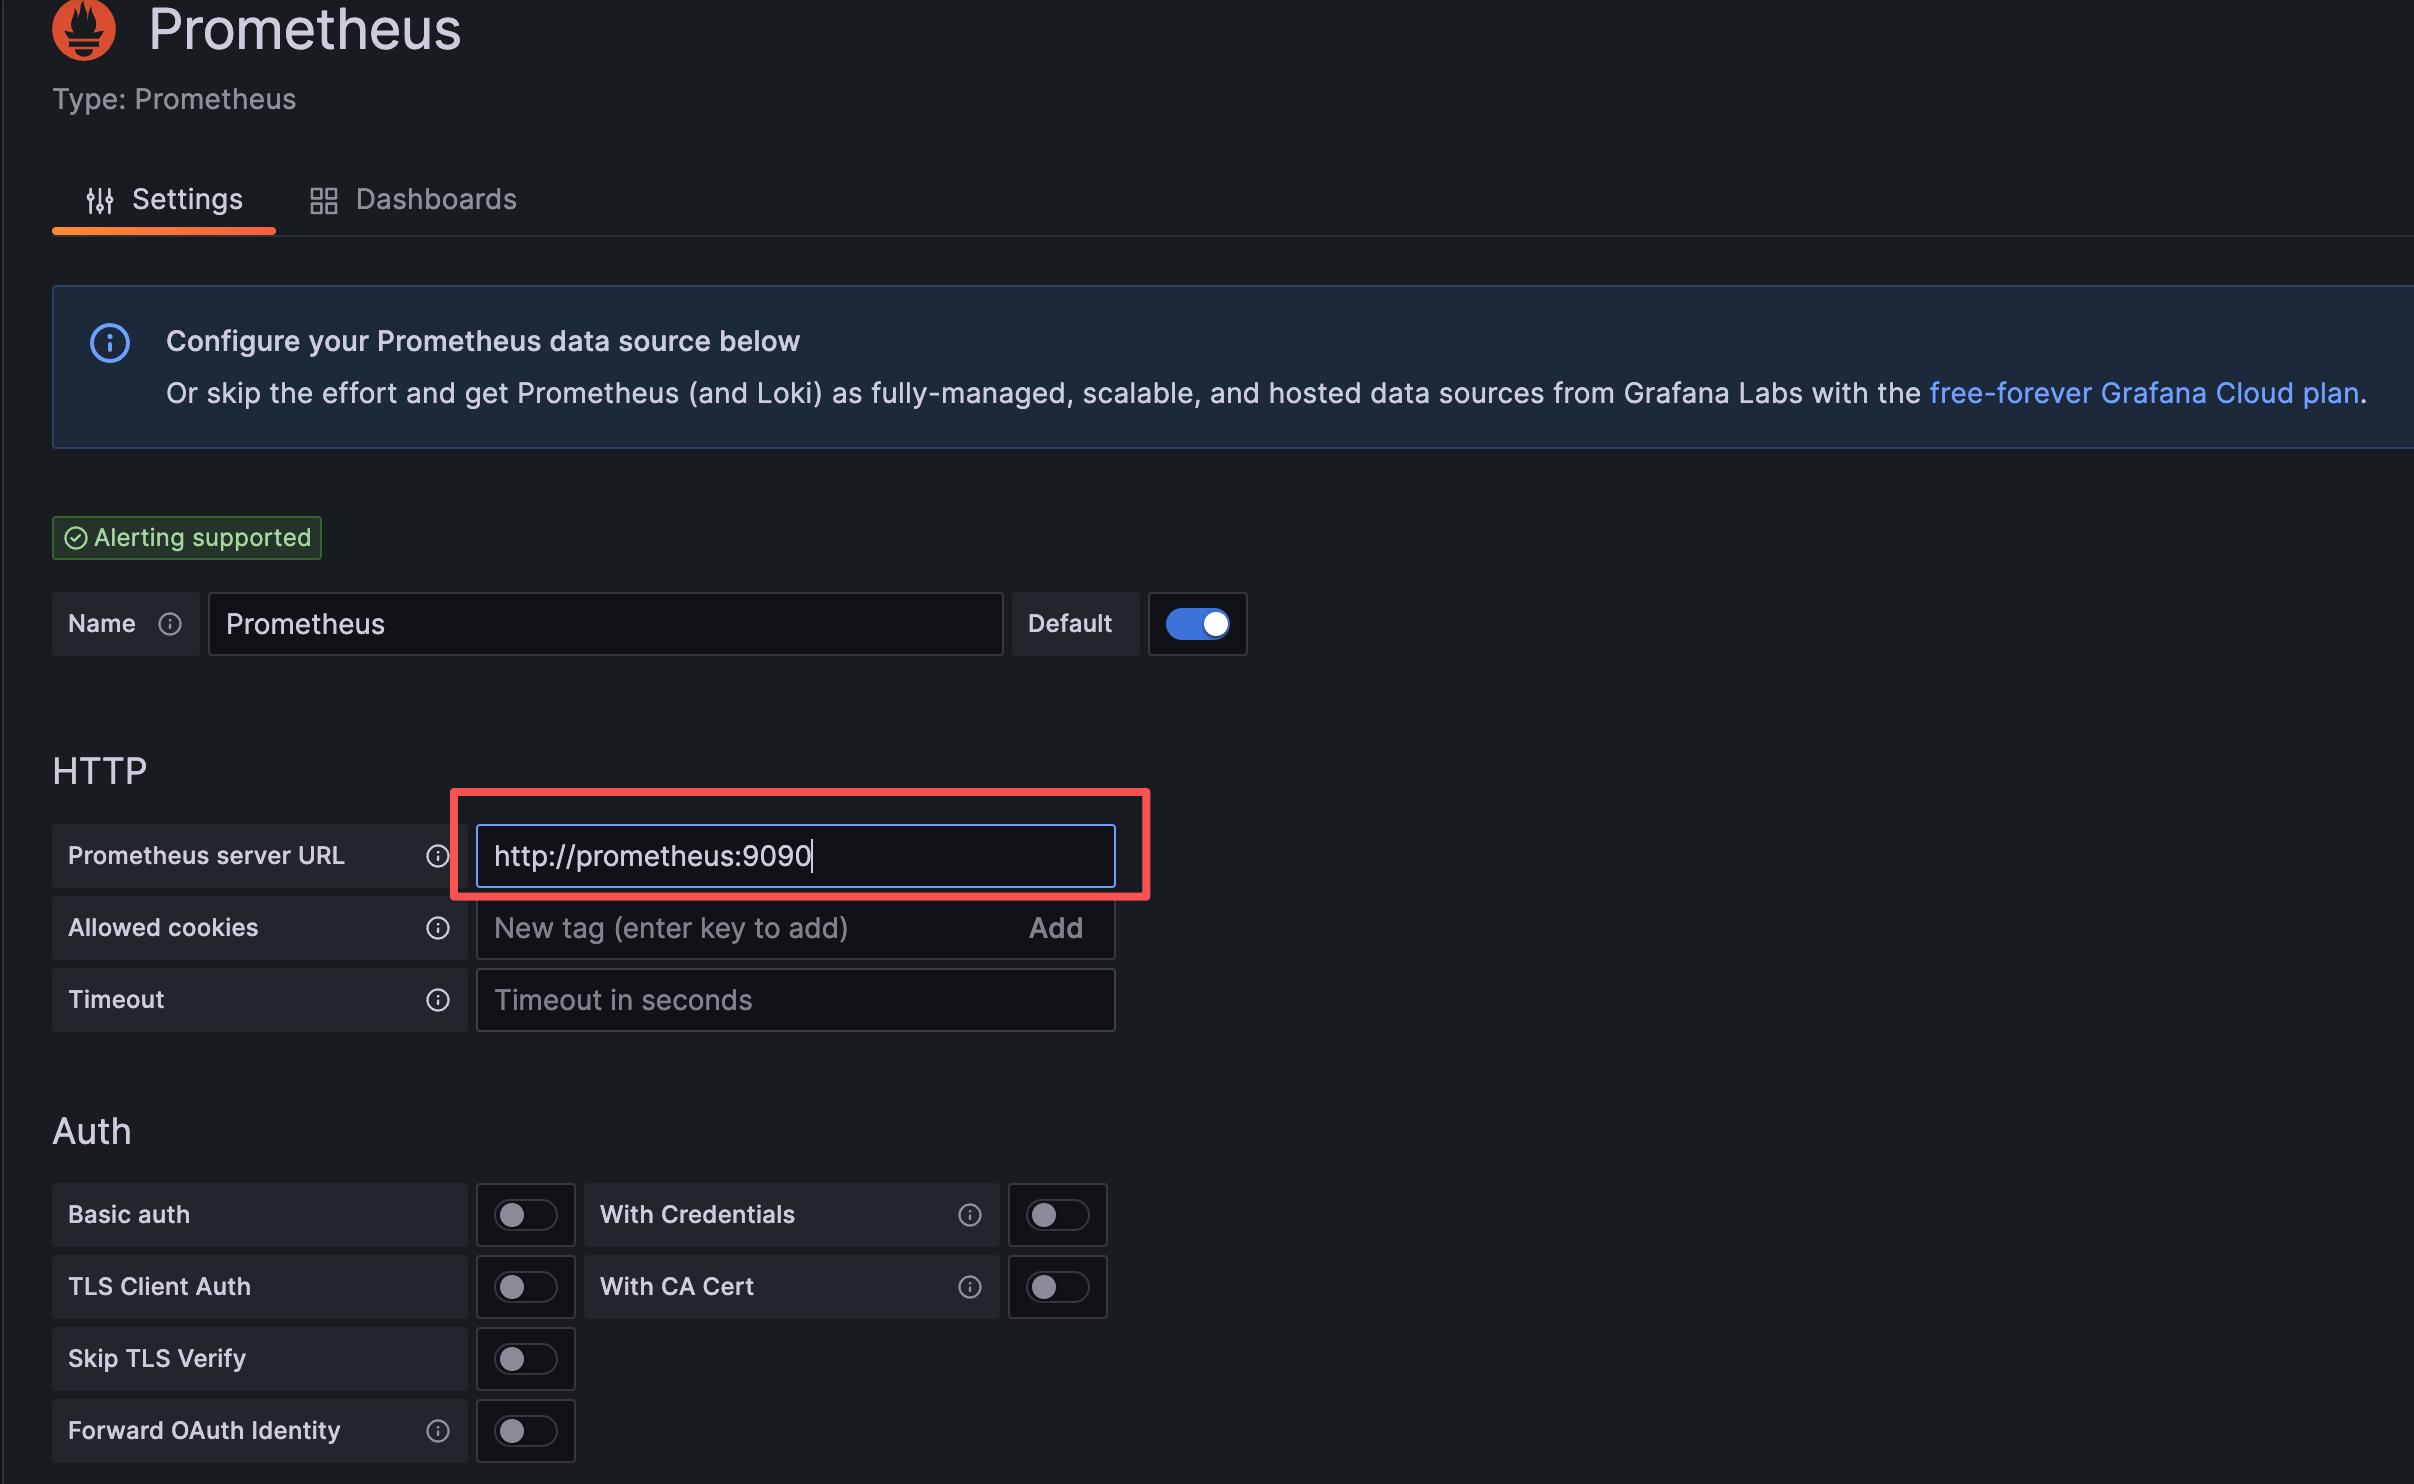
- 配置 URL:
http://prometheus:9090
⚠️ 注意:使用容器名 prometheus,不是 localhost
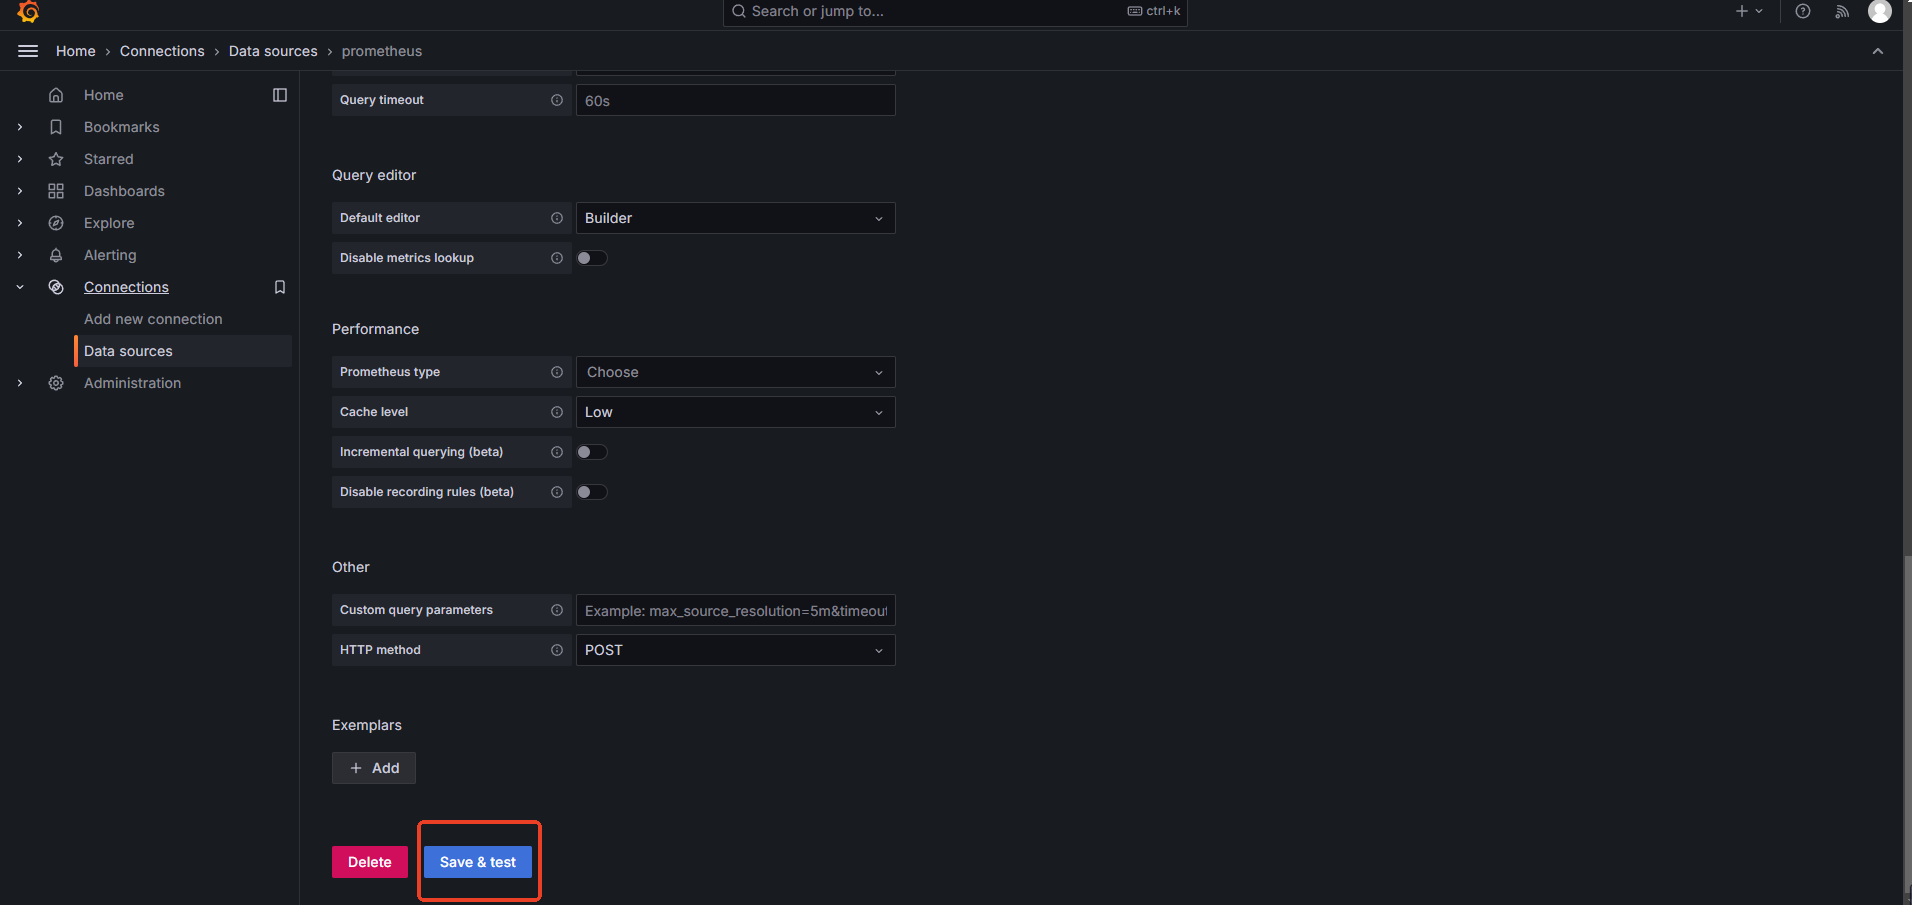
- 点击 Save & Test
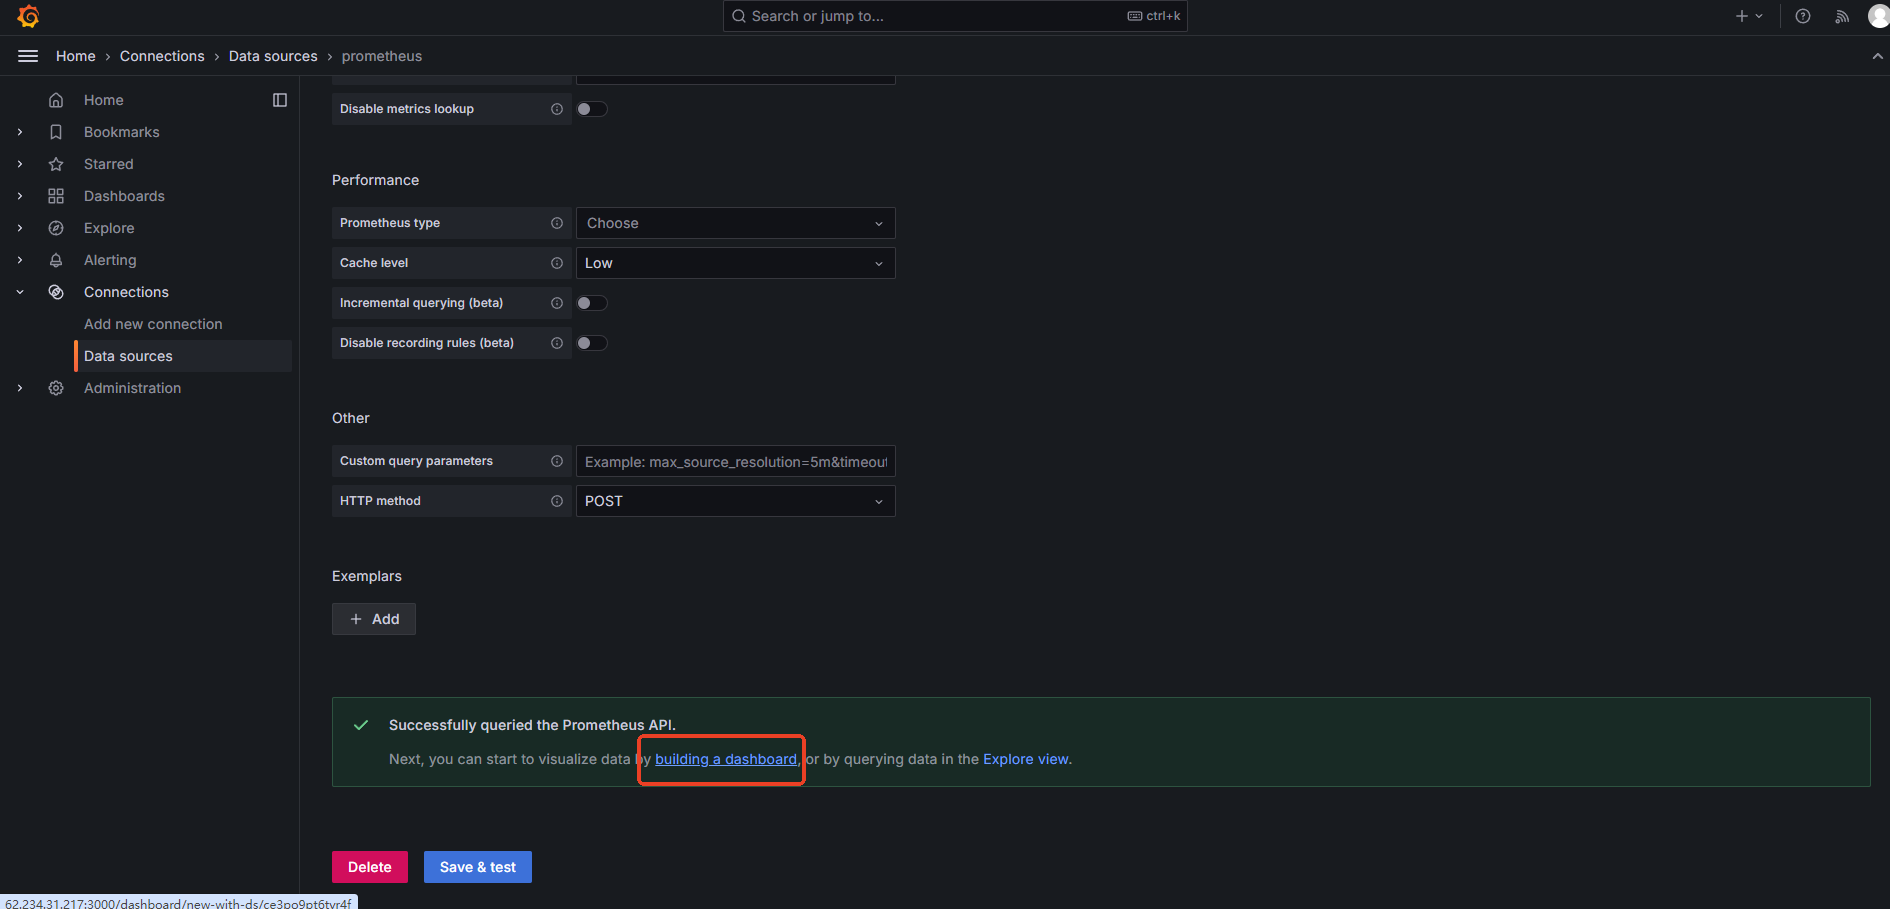
- 确认显示:✅ Successfully queried the Prometheus API
配置 Prometheus 地址
往下拉到底,进行保存
点击保存后会接着让你构建仪表板配置
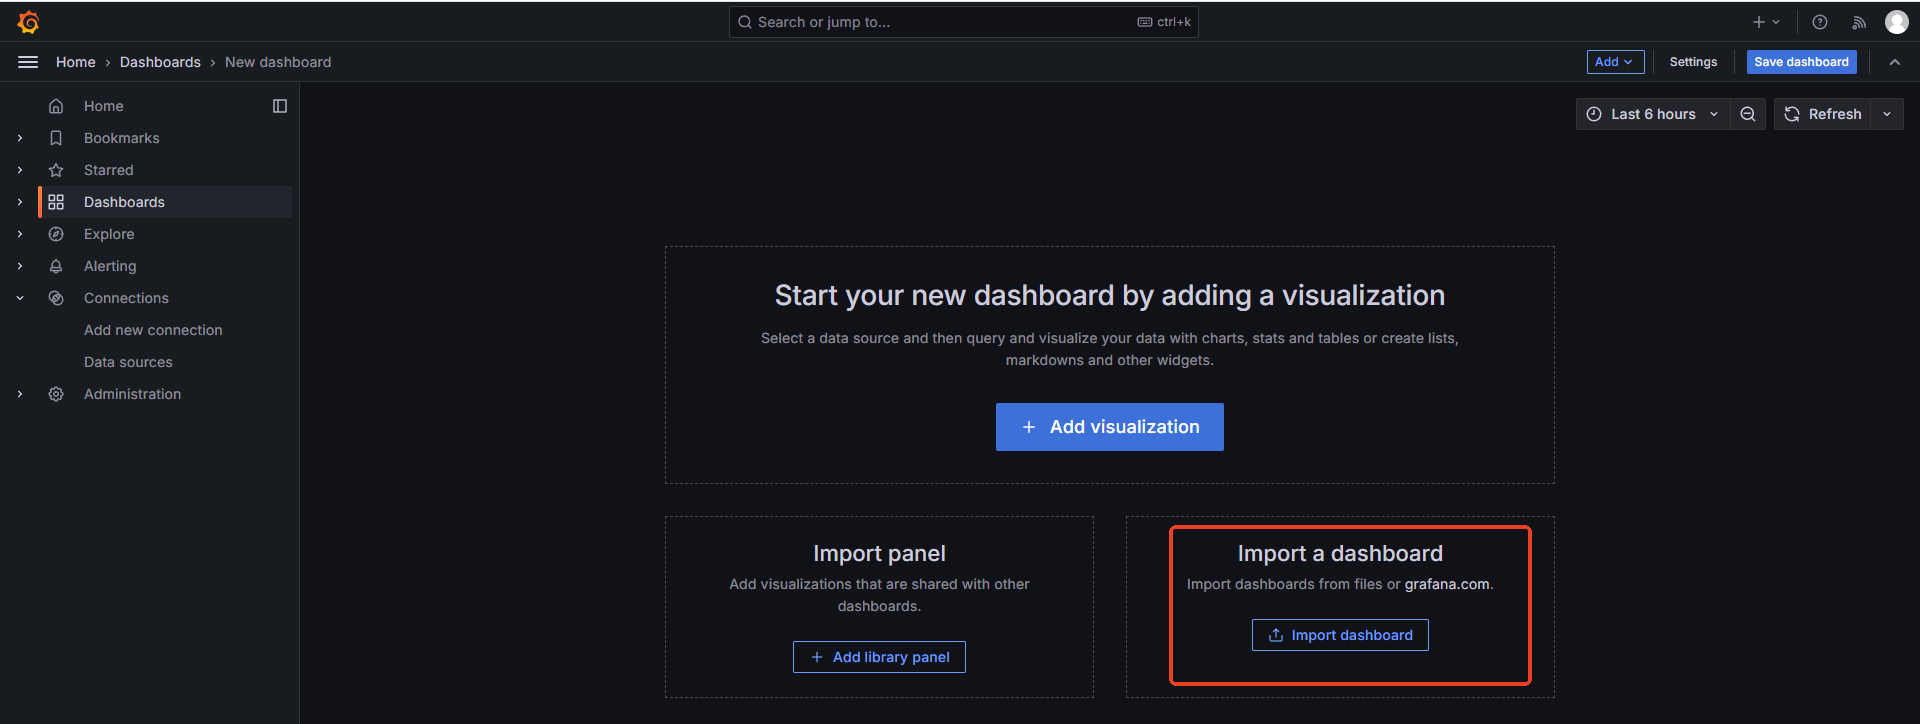
导入仪表板配置
把模板地址粘贴进去
我这里是用的监控jvm的模板,地址:
https://grafana.com/grafana/dashboards/4701-jvm-micrometer/
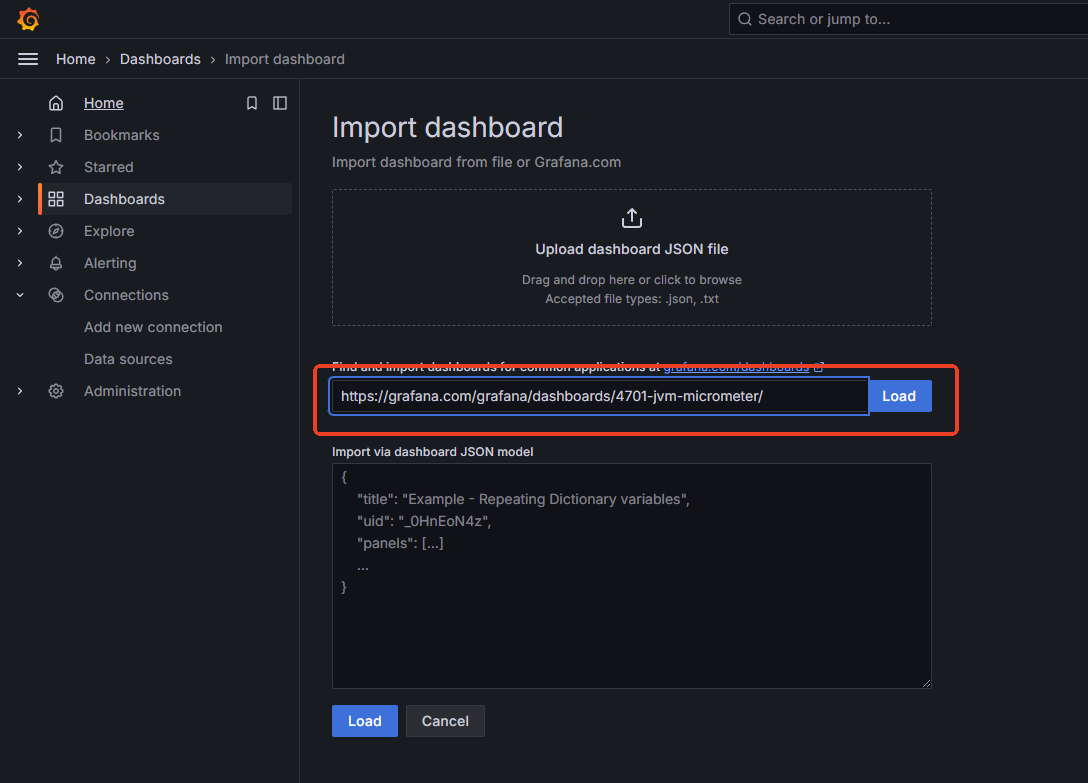
继续选择Prometheus
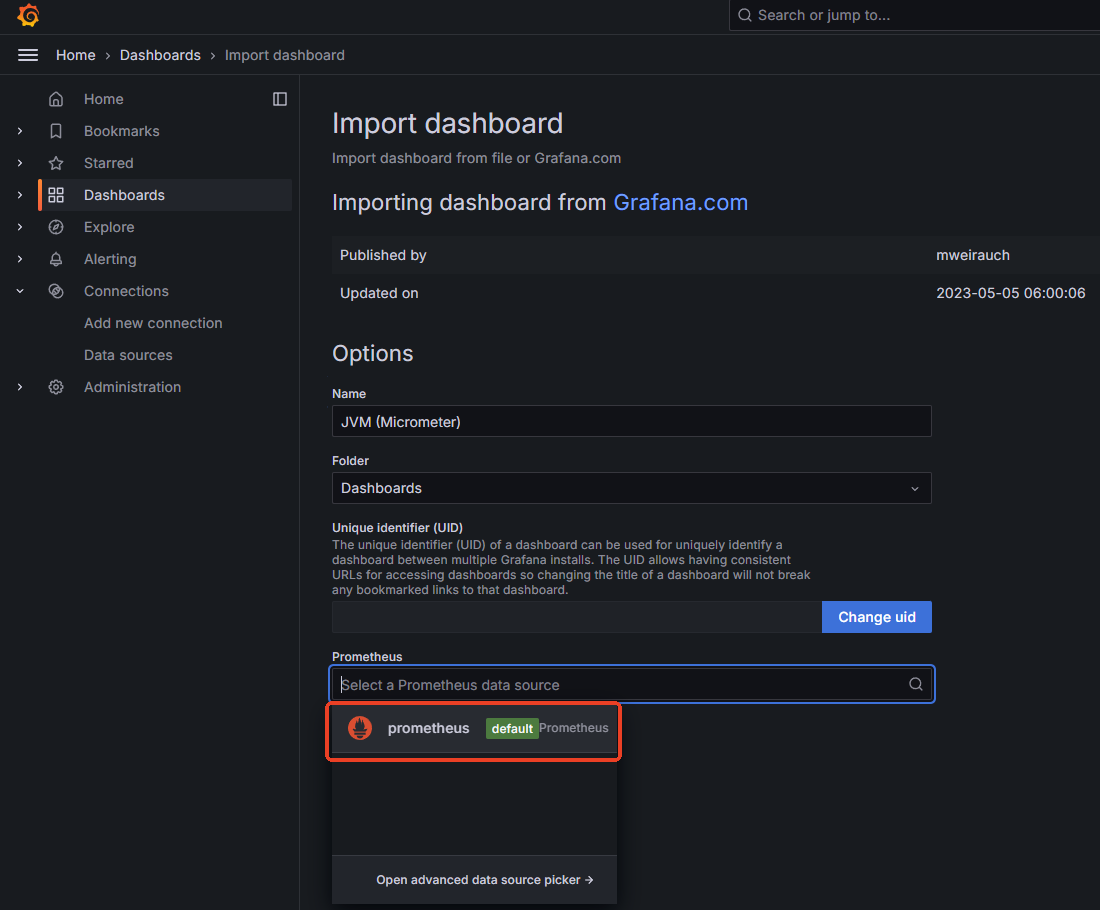
选择Import导入
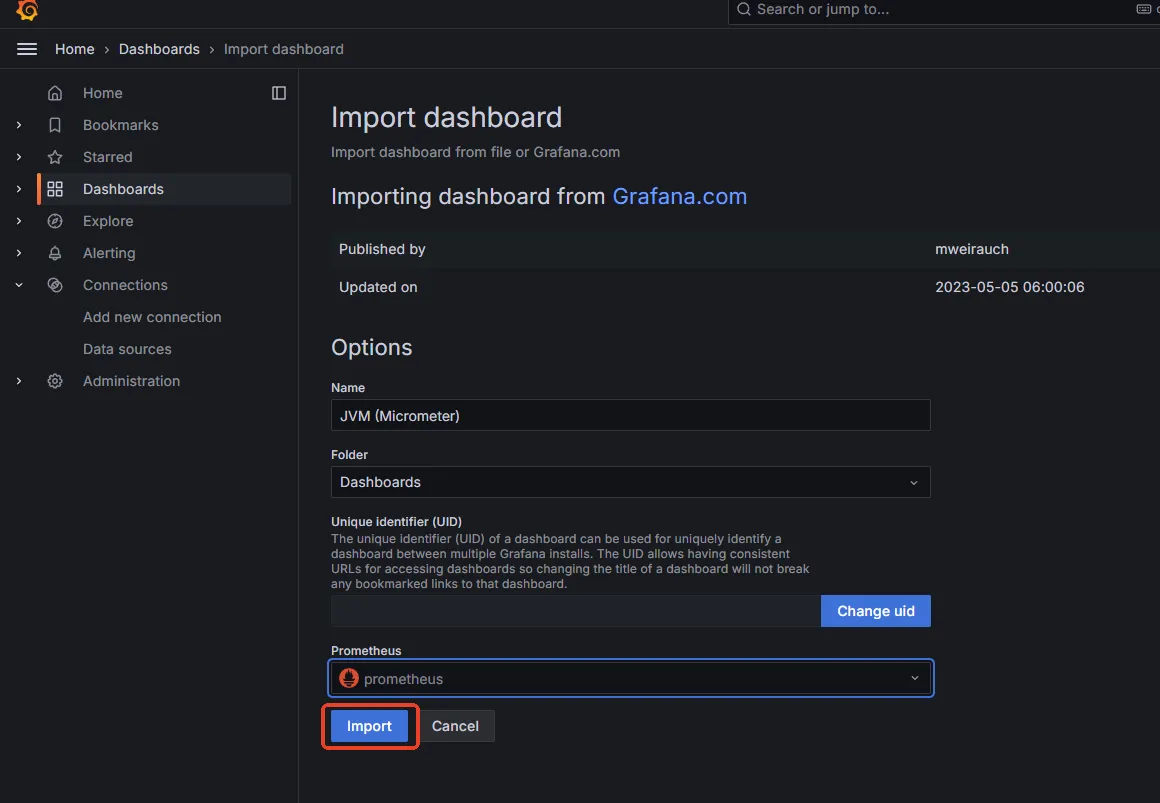
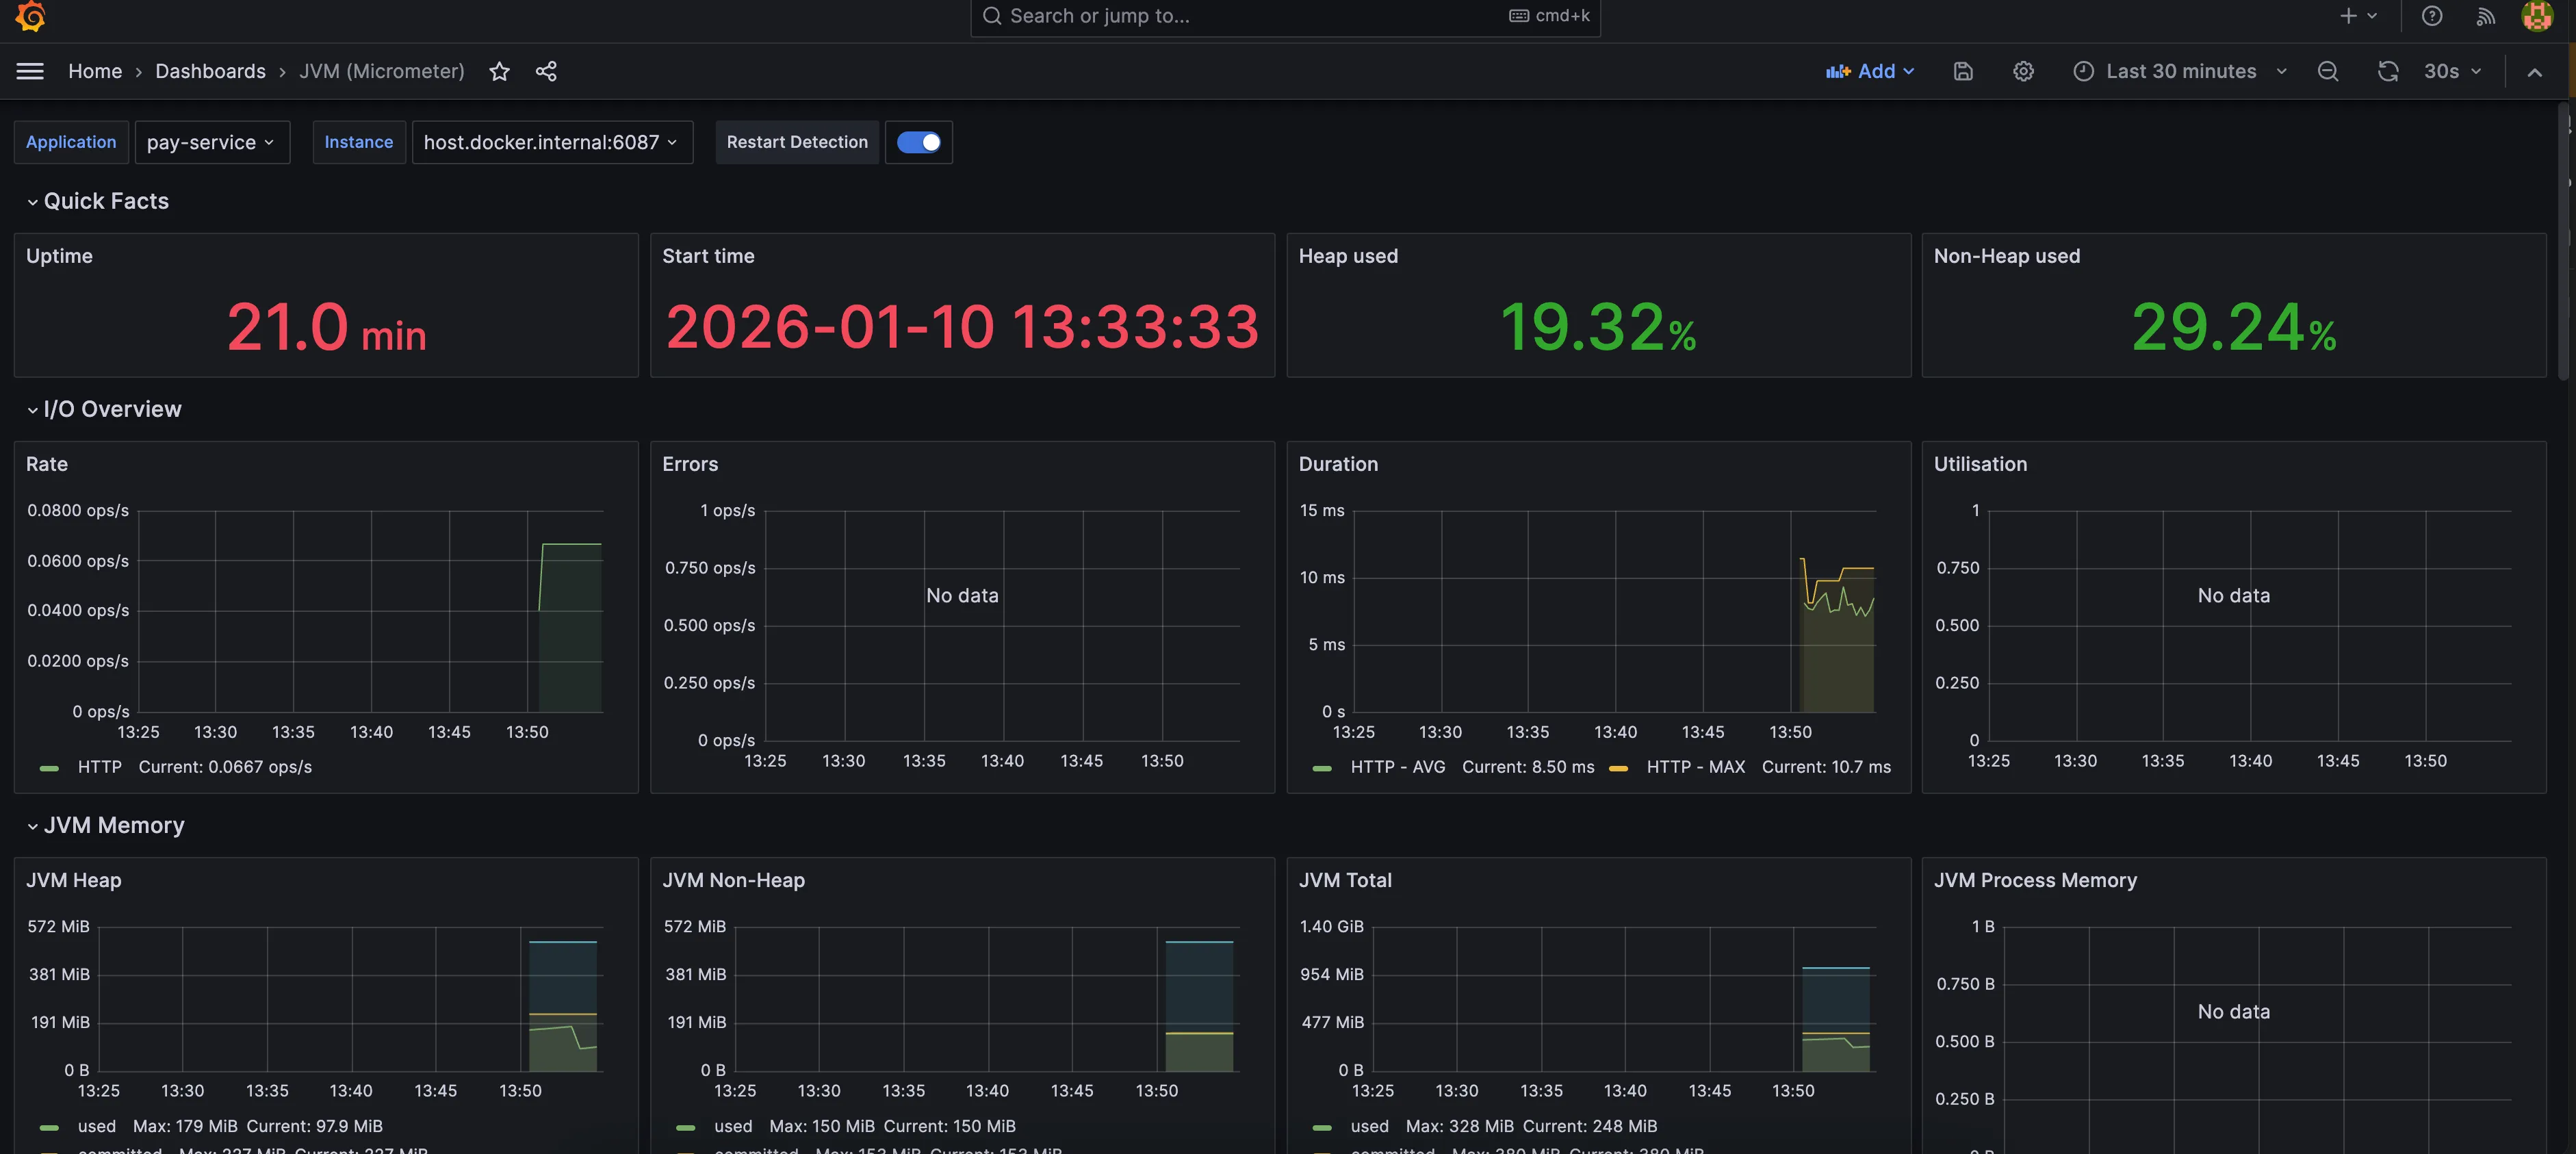
能看到相关信息了
导入其他预制的监控模板
除了 JVM 监控模板外,还可以监控其他的数据。
- 在 Grafana 中进入 Dashboards → Import
- 输入推荐的 Dashboard ID:
- 4701 - JVM (Micrometer) 监控
- 12900 - Spring Boot Statistics
- 11378 - JVM (Micrometer) Advanced
- 选择 Prometheus 数据源
- 点击 Import
验证 Dashboard
将大麦的服务都启动后,在 Dashboard 中应该能看到:
- JVM 内存使用情况
- CPU 使用率
- HTTP 请求统计
- 线程池状态
- GC 统计
验证监控系统
1. 启动大麦的服务
2. 检查 Actuator 端点
# 测试 Prometheus 端点
curl http://localhost:6083/actuator/prometheus
3. 检查 Prometheus Targets
访问:http://localhost:9090/targets
确认服务状态为 UP(绿色)
4. 查看 Grafana Dashboard
在 Grafana Dashboard 中应该能看到服务的实时监控数据
访问地址汇总
| 服务 | 地址 | 账号/密码 |
|---|---|---|
| Prometheus | http://localhost:9090 | - |
| Prometheus Targets | http://localhost:9090/targets | - |
| Grafana | http://localhost:3000 | admin / admin123 |
常用管理命令
容器管理
# 查看运行状态
docker ps

# 停止容器
docker stop prometheus grafana

# 启动容器
docker start prometheus grafana

# 重启容器
docker restart prometheus grafana

# 查看日志
docker logs -f prometheus
docker logs -f grafana

# 删除容器(数据保留在 volume)
docker rm -f prometheus grafana
网络管理
# 查看网络信息
docker network inspect monitoring

# 测试容器间连通性
docker exec -it grafana curl http://prometheus:9090/api/v1/targets
数据卷管理
# 查看数据卷
docker volume ls

# 查看数据卷详情
docker volume inspect prometheus_data
docker volume inspect grafana_data

# 备份数据(可选)
docker run --rm -v prometheus_data:/data -v $(pwd):/backup alpine tar czf /backup/prometheus-backup.tar.gz /data

# 删除数据卷(会丢失所有数据)
docker volume rm prometheus_data grafana_data
Prometheus 配置管理
# 修改配置后重新加载(无需重启容器)
curl -X POST http://localhost:9090/-/reload

# 验证配置
docker exec prometheus promtool check config /etc/prometheus/prometheus.yml
故障排查
问题 1:Prometheus 无法访问
# 检查容器状态
docker ps -a | grep prometheus

# 查看日志
docker logs prometheus

# 检查端口占用
lsof -i :9090  # macOS/Linux
netstat -ano | findstr :9090  # Windows
问题 2:Grafana 连接 Prometheus 失败
# 测试容器间网络连通性
docker exec -it grafana curl http://prometheus:9090/api/v1/targets

# 确认两个容器在同一网络
docker network inspect monitoring
问题 3:Spring Boot 服务状态为 DOWN
- 确认服务已启动:
curl http://localhost:6083/actuator/health - 确认 Prometheus 端点可访问:
curl http://localhost:6083/actuator/prometheus - 检查防火墙设置
- 查看 Prometheus 日志:
docker logs prometheus
问题 4:Dashboard 无数据
- 确认服务已启动且有请求流量
- 在 Prometheus 中执行查询测试:
up{job="damai-base-data-service"} - 检查 Dashboard 时间范围设置
- 等待几分钟让数据采集
注意事项
- 数据持久化:使用了 Docker Volume,删除容器不会丢失数据
- 安全建议:生产环境请修改 Grafana 默认密码
- 资源占用:Prometheus 数据保留 15 天,可根据需要调整
--storage.tsdb.retention.time参数 - 网络隔离:使用自定义网络
monitoring,容器间通信更安全稳定
添加自定义指标
除了利用SpringBootActuator中提供的内置指标,我们还可以通过Micrometer添加自定义监控指标,以监控特定的业务逻辑或性能瓶颈。
@RestController
public class CustomController {
private final Counter requestCounter;

public CustomController(MeterRegistry registry) {
    this.ordersCounter = Counter.builder("request_count")
                                .description("request count")
                                .register(registry);
}

@GetMapping("/order")
public String createOrder() {
    requestCounter.increment();
    return "success";
}
这样在Grafana中,可以像Prometheus一样展示自定义指标。